Jim Rickards has been telling anyone who will listen, for more than a decade, that the dollar is going to collapse. He put a date on it once. August 15, 2016, in a Daily Reckoning essay titled “The Day The Dollar Died,” he wrote: “Will history record September 4th, 2016 as the day the dollar died?”
September 4, 2026 was ten years later. Here is what the dollar actually did, dated and sourced, with the math.
The Prediction, Quoted and Dated
The dollar-collapse thesis runs through three of Rickards’ books — Currency Wars (2011), The Death of Money (2014), and The New Case for Gold (2016) — and through years of Daily Reckoning columns. The two sharpest dated claims:
August 15, 2016 — “The Day The Dollar Died Part I” (Daily Reckoning). Rickards wrote: “Will history record September 4th, 2016 as the day the dollar died? Before continuing, let me make it clear that you aren’t going to wake up on September 5th to find anything noticeably different… The dollar won’t lose its reserve currency status overnight.” He framed September 4, 2016 — the date of the G20 leaders’ meeting in Hangzhou, China, and the effective date of the yuan’s inclusion in the IMF’s SDR basket — as a turning point comparable to November 1914, when gold began flowing out of England to New York and sterling’s long decline began. He gave a horizon: “This process probably isn’t going to take 30 years. It could take 10 years or less.” And a prescription: “10 years from now it will become apparent that this was the time to get into gold, energy, silver, hard assets, land, fine art, and other assets that will preserve value.”
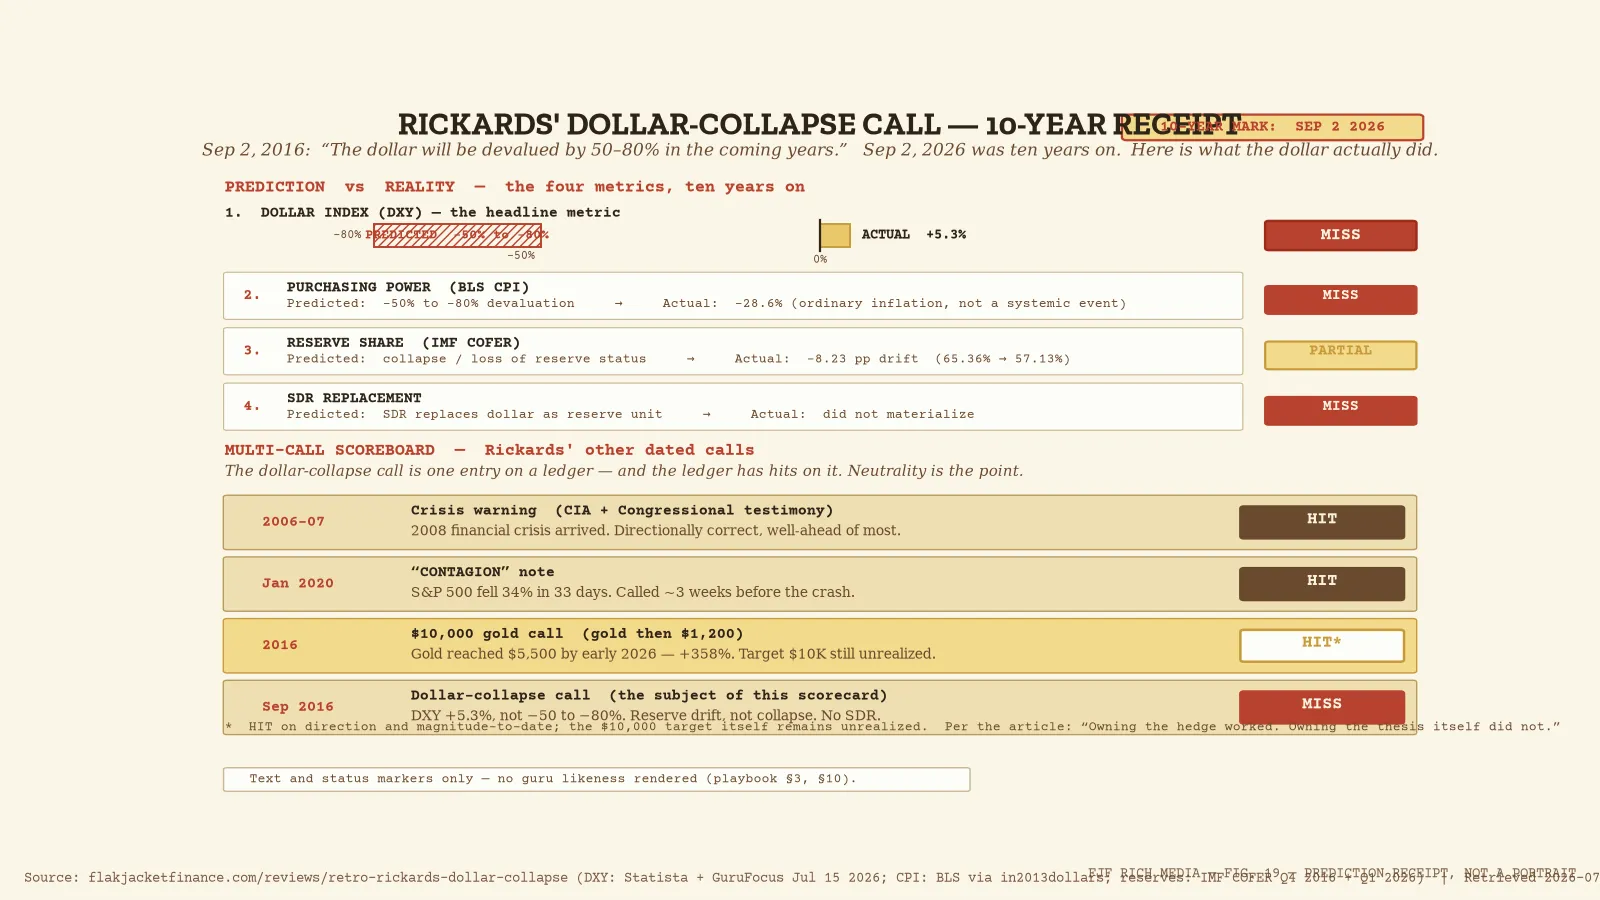
September 2, 2016 — “A Timetable for the Dollar’s Demise” (Daily Reckoning). Two weeks before the named date, Rickards put a number on it: “Based on past practice, we can expect that the dollar will be devalued by 50-80% in the coming years. A devaluation of this magnitude will wipe out the value of your life’s savings.”
The thesis was not invented for a promo. It was a book argument made in mainstream financial publications. But it was also, from 2016 forward, the spine of Rickards’ Paradigm Press newsletter Strategic Intelligence and the framing for years of lead-gen presentations. The dollar-collapse call is the product’s reason for existing. That makes the ten-year mark a fair moment to check the receipts.
What Happened, Dated and Sourced
The dollar index (DXY) went up, not down. Per Statista’s historical series, the U.S. Dollar Index closed at 95.46 in September 2016 and 96.02 in August 2016. As of July 15, 2026, the DXY stood at 100.495 per GuruFocus. That is a gain of roughly 5.3% over the near-decade — the opposite of a 50-80% devaluation. Investing.com’s daily series shows the index at 100.76 on July 17, 2026, in the same neighborhood. Against the basket of major fiat currencies the dollar was measured against, the dollar bought more, not less.
Purchasing power eroded, but not by 50-80%. The Bureau of Labor Statistics CPI series, as compiled by the in2013dollars calculator, shows $1 in 2016 has the purchasing power of approximately $1.40 in 2026 — a cumulative inflation of 39.63% over ten years, or an average of 3.39% per year. Inverted, that means the dollar lost roughly 28.6% of its domestic purchasing power. Real erosion, real loss for savers, but not the 50-80% devaluation Rickards projected. And the loss came through ordinary inflation, not a systemic currency event.
The dollar’s share of global reserves drifted down, slowly. The IMF’s Currency Composition of Official Foreign Exchange Reserves (COFER) survey — the dataset Rickards himself cites — shows the dollar’s share of allocated reserves at 65.36% at end of 2016 (Marc to Market, April 2017, citing the IMF Q4 2016 release). The IMF’s Q1 2026 data brief shows the dollar share at 57.13%. That is a decline of roughly 8 percentage points over ten years — a real, documented trend in the direction Rickards predicted, at a pace that is the opposite of “collapse.” The IMF’s own commentary notes that in Q1 2026 the dollar share actually ticked up, and that exchange-rate valuation effects — not active dumping — account for much of the quarterly movement. Central banks are not fleeing the dollar. They are slowly diversifying at the margins.
No SDR replacement arrived. The September 4, 2016 G20 meeting and yuan-SDR inclusion happened exactly as scheduled. Ten years later, the SDR remains a niche IMF accounting unit. No private SDR bond market of consequence exists. The BRICS summit in Kazan (October 2024) that Rickards flagged in his “Gradually, Then Suddenly” essay as a major advance produced announcements, not a viable payment currency. The dollar’s reserve role is intact, eroded at the edges but unbroken.
The Math
| Metric | Value | Date | Source |
|---|---|---|---|
| DXY (Rickards’ named date month) | 95.46 | Sep 2016 | Statista historical DXY series |
| DXY (Rickards’ essay month) | 96.02 | Aug 2016 | Statista historical DXY series |
| DXY (10-year mark) | 100.495 | Jul 15, 2026 | GuruFocus, citing DXY |
| DXY change Sep 2016 to Jul 2026 | +5.27% | 10-year window | Calculated from above |
| Rickards’ projected dollar devaluation | 50-80% | Forecast, Sep 2, 2016 | Daily Reckoning |
| Dollar purchasing power loss (CPI) | ~28.6% | 2016-2026 | BLS CPI / in2013dollars |
| Cumulative CPI inflation 2016-2026 | 39.63% | 2016-2026 | BLS / in2013dollars |
| Dollar share of global reserves (Q4 2016) | 65.36% | End 2016 | IMF COFER, cited via Marc to Market |
| Dollar share of global reserves (Q1 2026) | 57.13% | Q1 2026 | IMF COFER data brief |
| Reserve share decline | -8.23 pp | 10-year window | Calculated from above |
| SDR private bond market | Did not materialize | 2016-2026 | IMF COFER data, market observation |
The dollar index rose 5%, domestic purchasing power fell 29%, reserve share drifted down 8 points over a decade. None of these is a 50-80% devaluation. None of them is a collapse.
The Scoreboard Context: Rickards’ Other Dated Calls
This is one entry on a ledger, and the ledger has hits on it. According to the Rickards corpus and mainstream coverage:
- 2006-2007 (CIA and Congressional testimony): Warned of conditions leading to the 2008 financial crisis. The crisis arrived. Directionally correct and well-ahead of most.
- January 2020 (“CONTAGION” note): Predicted a pandemic-driven market panic roughly three weeks before the February-March 2020 crash. The S&P 500 fell 34% in 33 days. Directionally correct and well-timed.
- 2016 ($10,000 gold call): Published in The New Case for Gold when gold was $1,200. Gold reached $5,500 by early 2026 — a 358% gain. The $10,000 target is still unrealized, but the direction and the magnitude-to-date are strong. (Covered in detail in our Rickards gold prediction track record page.)
- September 4, 2016 dollar-collapse call: The DXY rose 5% over ten years. The dollar lost 29% of purchasing power to inflation, not 50-80% to a systemic event. Reserve share fell 8 points over a decade, not collapsed. No SDR replacement. Wrong on magnitude, wrong on the collapse, partially right on direction (slow reserve diversification) — and right about gold, which is the other side of the trade.
Three real hits (2008, 2020, gold direction) precede this call. The dollar-collapse call got the direction of reserve diversification right at the margin and the disaster wrong. The gold call — the asset you were supposed to buy if you believed the dollar-collapse thesis — has been the winner. Owning the hedge worked. Owning the thesis itself did not.
What the Record Tells a Reader
Rickards’ methodology — the 30-40 year monetary-system cycle, the historical precedent of the 1971 collapse, the structural problems of dollar hegemony, the weaponization of the currency through sanctions — is grounded in real data. The dollar’s reserve share has declined. Domestic purchasing power has eroded. These are facts, and they are part of why the gold call has worked.
But “the dollar will be devalued by 50-80% in the coming years” is a specific claim, and ten years on, the DXY is up 5%, not down 50-80%. A 29% loss of purchasing power to ordinary inflation is a slow tax on savers, not a monetary-system collapse. A reserve-share decline of 8 points over a decade is drift, not rupture. The September 4, 2016 date Rickards himself named as “the day the dollar died” passed without the dollar losing reserve status, without the SDR replacing it, and without the 50-80% devaluation.
The record says this: the structural critique is sound, the cycle work is real, and the hedge (gold) has paid off. But the specific disaster call — the dated collapse that was supposed to make the hedge necessary — did not arrive on the timeline Rickards gave. The dollar’s decline, to the extent it is happening, is the gradual kind. Rickards himself wrote, in October 2024, that the process “happens slowly and incrementally over decades” and “the dollar could lose its reserve status gradually — then suddenly.” The gradually part is in evidence. The suddenly part, ten years on, is not.
The reader who bought gold in 2016 because they believed Rickards is up 358%. The reader who held dollars is down 29% in real terms. The reader who waited for the collapse to arrive before acting is still waiting. The scoreboard says the hedge was right and the disaster was late, and those are two different things that a lot of newsletter copy conflates. For the monetary architecture Rickards built this call on top of, see The Petrodollar Explained: 1974 to Today. For the full reviews index, see Newsletter Reviews.