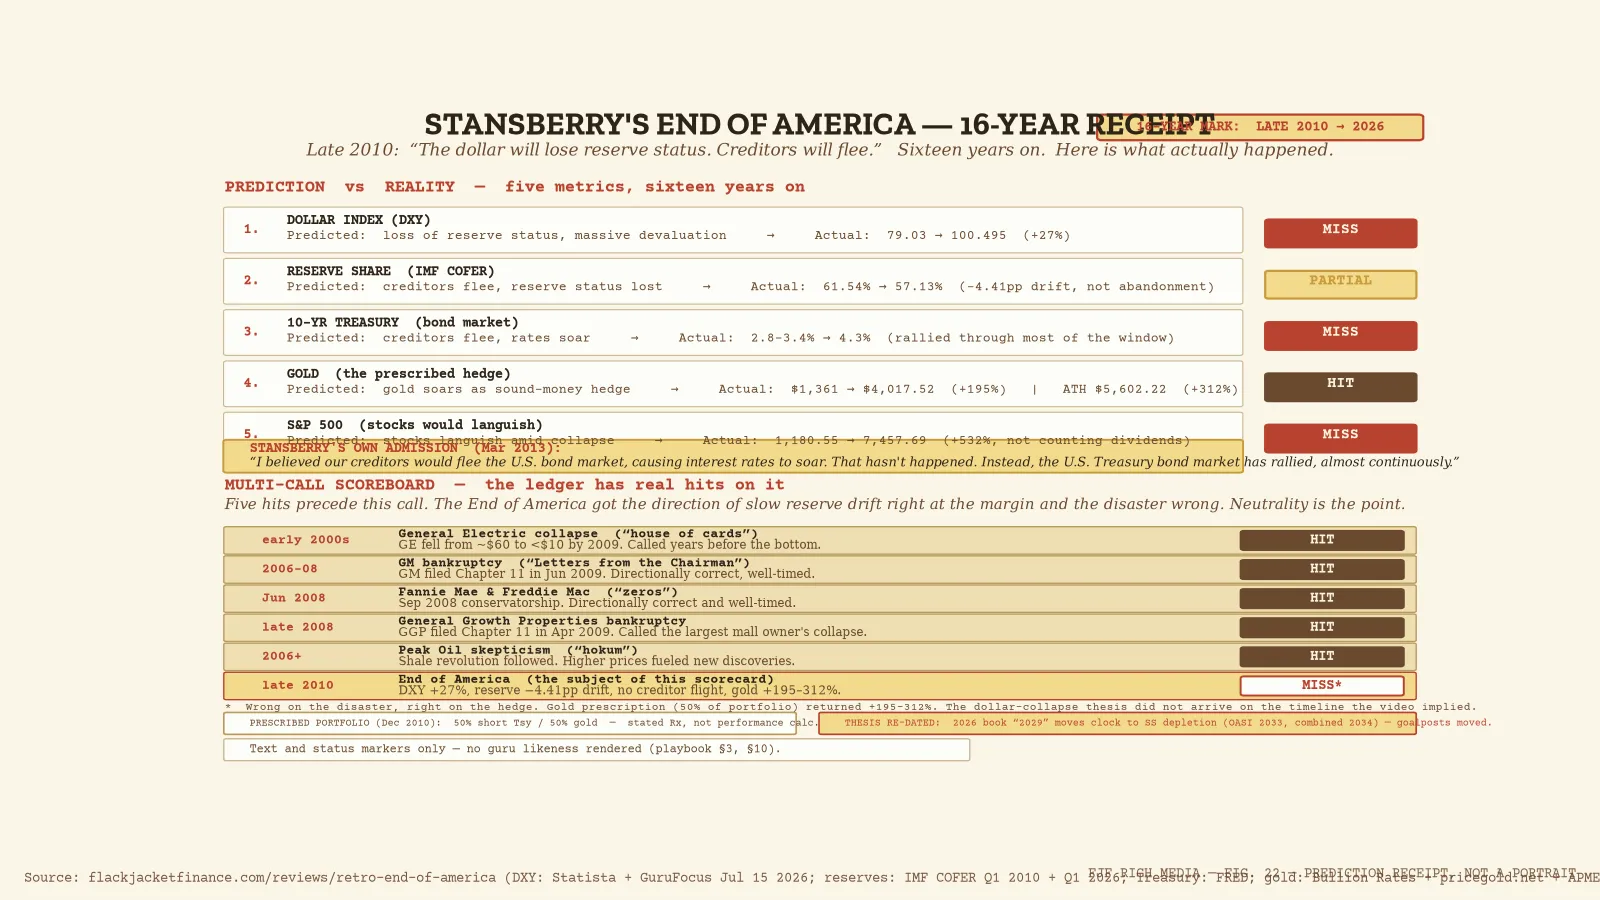
In late 2010, Porter Stansberry released a video called “The End of America.” It was, by Stansberry Research’s own count, watched more than 20 million times, which made it one of the most-viewed financial presentations of the past quarter century. The thesis had four moving parts: the dollar would lose its reserve status, creditors would flee U.S. bonds, the printing press would trigger a currency crisis, and gold would soar as the sound-money hedge. Stansberry prescribed gold, silver, energy, agriculture, and assets outside the U.S.
Sixteen years have passed. Stansberry himself revisited the call in a March 2013 Stansberry Research essay titled “The One Thing I Got Wrong About the ‘End of America’” and said, in plain words, that the bond-market collapse half of his prediction “has been totally wrong.” The other halves have a more complicated scoreboard. Here is what happened, dated and sourced, with the math.
The Prediction, Quoted and Dated
The End of America video was released in late 2010. Brian Deer’s archived coverage dates it to late 2010 and describes it as “heavily promoted in media as the flagship for a new campaign.” Stansberry Research’s own “Porter’s End of America Interview, Part IV” digest was published December 23, 2010, with editor Sean Goldsmith framing the video as the event of that fall. In that interview, Stansberry summarized the thesis in his own words:
“I believe that America’s mounting debts (particularly our runaway federal government’s debts) will cause our creditors to abandon the U.S. dollar. They will do so not in a deliberate effort to sink our economy, but in an effort to hedge their exposure to the inevitable inflation that must result as America prints trillions of dollars to repay its debts. In this scenario, the U.S. dollar would lose its standing as the world’s reserve currency, causing a cascade of further financial, political, and social problems, including a massive devaluation of the dollar.”
The prescription was specific. In the same December 2010 interview, Stansberry said: “The simple answer is, you have three well-known ways to protect yourself from inflation: own energy, own agriculture, and own sound money… Sound money just means buying gold and silver.” And in a December 27, 2010 Gold Report interview syndicated on Streetwise Reports and Mining.com, he put a portfolio framework around it: “If you put 50% of your portfolio in very short-term Treasury bonds, like one-year Treasury bonds, and the other 50% in gold, you’ve really set up a perfectly hedged position.”
The thesis was not built for a single promo. It ran through Stansberry’s newsletters for years — Stansberry’s Investment Advisory, the free Stansberry Digest, and the “Project to Restore America” campaign that followed the video. Stansberry Research’s own “Revisiting the End of America” digest, published as the Treasury Borrowing Advisory Committee warned the dollar’s reserve status “appears to be slipping,” treated the thesis as the firm’s signature work. The End of America video was the product. Everything Porter has published since, including the 2026 book 2029: The End of America, is an update to this same spine.
What Happened, Dated and Sourced
The dollar did not lose reserve status. It rose against other fiat currencies. Per the Federal Reserve’s H.10 release and Statista’s historical DXY series, the U.S. Dollar Index closed November 2010 at roughly 79.03 (Statista Dec 2010 reading) and ranged between 72.30 and 81.20 through the back half of 2010. As of July 15, 2026, the DXY stood at 100.495 per GuruFocus, with Investing.com’s daily series showing 100.76 on July 17, 2026. That is a gain of roughly 25-27% over sixteen years against the basket of major fiat currencies the index measures. The dollar bought more, not less, against the euro, yen, pound, Swiss franc, Canadian dollar, and Swedish krona. The reserve-currency status Stansberry said would be lost is still intact.
The dollar’s share of global reserves drifted down, slowly. The IMF’s Currency Composition of Official Foreign Exchange Reserves (COFER) survey — the dataset Stansberry’s own essay cites — shows the dollar’s share of allocated reserves at 61.54% in Q1 2010 (Euromoney, June 2010, citing the IMF release), down from 62.17% in Q4 2009. The IMF’s Q1 2026 data brief shows the dollar share at 57.13%. That is a decline of roughly 4.4 percentage points over sixteen years — a real, documented trend in the direction Stansberry predicted, at a pace that is the opposite of abandonment. Central banks diversified at the margins. None fled.
Creditors did not flee U.S. bonds. The Treasury market rallied. This is the half Stansberry himself conceded. In the March 2013 Stansberry Research “Masters Series” essay, he wrote: “I believed that as America continued to rack up trillions in new debt… our creditors would flee the U.S. bond market, causing interest rates to soar. That hasn’t happened. Instead, the U.S. Treasury bond market has rallied, almost continuously.” The 10-year Treasury yield sat near 2.8-3.4% in late 2010. It spent most of the 2010s below 3%, bottomed near 0.5% in 2020, and traded around 4.3% in mid-2026. Rates rose at the back end of the window, but the creditor flight Stansberry predicted did not arrive. The Fed, foreign central banks, and private buyers absorbed trillions in new issuance.
Gold soared — the hedge was the call that worked. Per Bullion Rates’ daily series and StatMuse, gold averaged roughly $1,361 per ounce in November 2010, with a 2010 annual average of $1,227.31. Gold peaked at $5,602.22 on January 28, 2026 (APMEX historical high), and traded at $4,017.52 on July 17, 2026 (pricegold.net). From the November 2010 average to the July 2026 spot, that is a gain of roughly 195%. From the 2010 average to the January 2026 peak, it is roughly 356%. The reader who followed the prescription and put half their portfolio in gold did very well. The reader who followed the thesis and waited for the dollar collapse did not.
The stock market did not languish. Per Yahoo Finance and FRED, the S&P 500 closed November 30, 2010 at 1,180.55 and December 31, 2010 at 1,257.64. On July 17, 2026, the index closed at 7,457.69 per FRED. That is a gain of roughly 531-547% over the sixteen-year window, not counting dividends. The “stocks would languish” framing in Stansberry’s original thesis was the call that missed worst.
The Math
| Metric | Value | Date | Source |
|---|---|---|---|
| DXY (End of America video month) | ~79.03 | Nov-Dec 2010 | Statista historical DXY series |
| DXY (16-year mark) | 100.495 | Jul 15, 2026 | GuruFocus, citing DXY |
| DXY change 2010 to 2026 | +~27% | 16-year window | Calculated from above |
| Dollar share of global reserves (Q1 2010) | 61.54% | Q1 2010 | IMF COFER, cited via Euromoney |
| Dollar share of global reserves (Q1 2026) | 57.13% | Q1 2026 | IMF COFER data brief |
| Reserve share decline | -4.41 pp | 16-year window | Calculated from above |
| 10-year Treasury yield (late 2010) | ~2.8-3.4% | Nov-Dec 2010 | FRED daily series |
| 10-year Treasury yield (mid-2026) | ~4.3% | Jul 2026 | FRED daily series |
| Gold price per oz (End of America month) | ~$1,361 | Nov 2010 avg | Bullion Rates, StatMuse |
| Gold price per oz (16-year mark) | $4,017.52 | Jul 17, 2026 | pricegold.net |
| Gold price per oz (ATH) | $5,602.22 | Jan 28, 2026 | APMEX historical high |
| Gold gain 2010 to 2026 spot | +~195% | 16-year window | Calculated from above |
| Gold gain 2010 to 2026 peak | +~312% | 16-year window | Calculated from above |
| S&P 500 (End of America month) | 1,180.55 | Nov 30, 2010 | Yahoo Finance |
| S&P 500 (16-year mark) | 7,457.69 | Jul 17, 2026 | FRED |
| S&P 500 gain 2010 to 2026 | +~532% | 16-year window | Calculated from above |
| Stansberry’s prescribed portfolio | 50% short Treasury / 50% gold | Dec 2010 | Streetwise Reports, Mining.com |
| Stansberry’s self-assessment (bond collapse) | “Totally wrong” | Mar 2013 | Stansberry Research Masters Series |
The dollar index rose 27%, reserve share fell 4 points over 16 years, gold rose 195% to 312% depending on the exit, and the S&P rose 532% — while Stansberry himself flagged the bond-collapse call as wrong three years in.
The Scoreboard Context: Stansberry’s Other Dated Calls
This retrospective is one entry on a ledger, and the ledger has real hits on it. Per the Porter Stansberry corpus and Barron’s characterization of his record as “remarkably prescient”:
- General Electric collapse (early 2000s): Called GE a “house of cards” that would collapse like Enron. GE fell from roughly $60 in 2000 to under $10 by 2009. Directionally correct, well-timed, and the call ran for years before the bottom.
- General Motors bankruptcy (2006-2008): Wrote “Letters from the Chairman of General Motors” explaining why GM was doomed. GM filed Chapter 11 in June 2009. Directionally correct and well-timed.
- Fannie Mae and Freddie Mac (June 2008): Called them “zeros” shortly before the September 2008 conservatorship. Directionally correct and well-timed.
- General Growth Properties (late 2008): Warned the largest mall owner in the U.S. was headed for bankruptcy. GGP filed Chapter 11 in April 2009 — directionally correct and well-timed.
- Peak Oil skepticism (2006 onward): Argued “Peak Oil” was hokum and that higher prices would fuel new discoveries. The shale revolution followed. Directionally correct.
- End of America (2010): Dollar index up 27%, reserve share down 4 points over 16 years, no creditor flight, no bond collapse (Stansberry himself said so in 2013), gold up 195-312% (the hedge was right), and S&P up 532% (the “stocks would languish” framing was wrong). Wrong on the disaster, right on the hedge, partially right on the direction of slow reserve diversification.
Five real hits precede this call. The End of America thesis got the direction of slow reserve diversification right at the margin and the disaster wrong. The gold call — the asset you were supposed to buy if you believed the thesis — has been the winner, same pattern as the other side of Rickards’ dollar-collapse trade. Owning the hedge worked, while owning the thesis itself for sixteen years and counting did not arrive on the timeline the video implied.
What the Record Tells a Reader
Stansberry’s methodology — the debt-to-GDP arithmetic, the historical precedent of reserve currencies losing status, the structural incentives of a printing-press currency, the political unsustainability of unfunded liabilities — is grounded in real numbers. The debt is higher, the unfunded liabilities are larger, and the dollar’s reserve share has drifted down. These are facts, and they are part of why the gold prescription has worked.
But “creditors will abandon the U.S. dollar” and “the U.S. dollar would lose its standing as the world’s reserve currency” are specific claims, and sixteen years on, the DXY is up 27%, the reserve share is down 4 points over a decade and a half, and the Treasury bond market rallied through most of the window. Stansberry himself, three years in, called the bond-collapse half of the prediction “totally wrong” and framed the real test as coming when the Fed eventually sold down its holdings. That test has not arrived in the form the video implied either.
The 2026 book, 2029: The End of America, reframes the thesis around a new dated claim: Social Security trust fund depletion. Per the 2025 OASDI Trustees Report, the OASI Trust Fund is projected to deplete in 2033, the combined OASDI funds in 2034, at which point benefits are cut automatically by law to roughly 77-81% of scheduled amounts. Stansberry’s Substack essay “The Arithmetic of Inevitability” cites the same trustees report and argues that under stress scenarios the depletion arrives closer to 2029. The date moved. The mechanism moved — from a dollar creditor run to a Social Security actuarial cliff. The prescription stayed the same: gold, sound money, the Permanent Portfolio.
The record says this: the structural critique is sound, the gold prescription has paid, and the specific disaster call — the dated collapse the 2010 video implied was imminent — did not arrive on the timeline the audience was given. The reader who bought gold in 2010 because they believed Stansberry is up roughly 195-312%. The reader who held dollars is down real purchasing power to inflation but up nominal value against other fiat. The reader who waited for the collapse before acting is still waiting, and the same thesis is now being re-dated to 2029. The hedge was right and the disaster was late — two different things that sixteen years of newsletter copy have conflated. For the full review of the newsletter the End of America was built to sell, see Porter & Co: Complete Investor Review. For the 2029 book’s core thesis, see Porter Stansberry’s 2029 Thesis. For the full reviews index, see Newsletter Reviews.